
Sequential Function Chart
A chart is built from steps, transitions and actions. The active step runs its actions. A transition moves the chart to the next step when its condition is on.
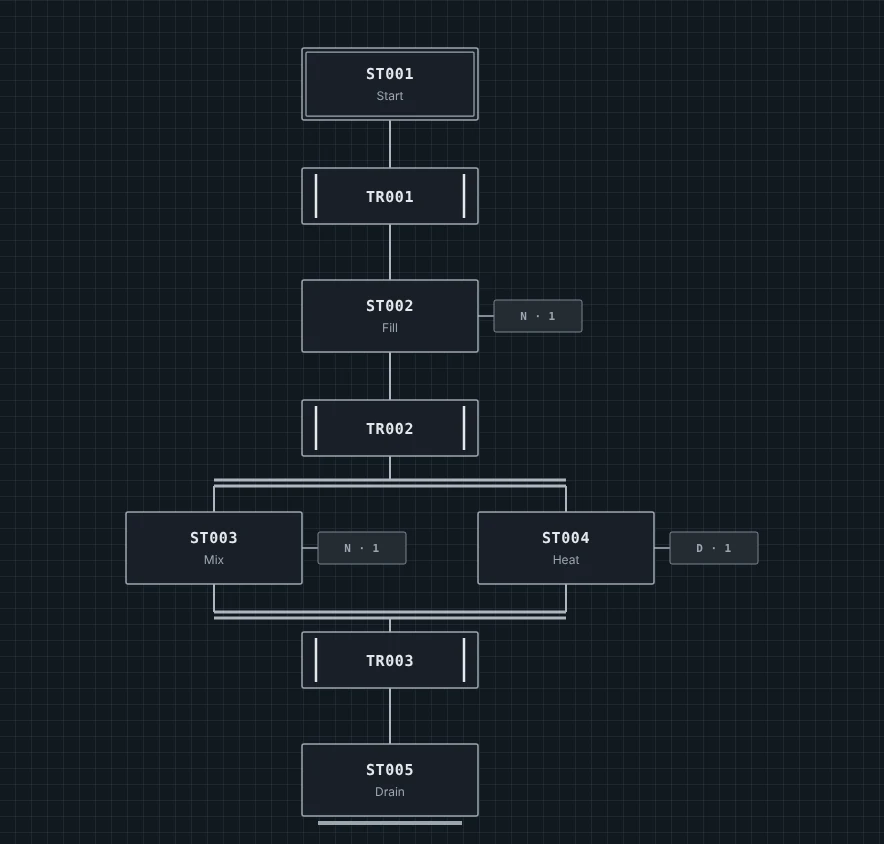
What a chart is made of
| Element | What it does | Its tag |
|---|---|---|
| Step | One state. Its actions run while it is active. The initial step, with a double border, is where the chart starts. | Status tag: on while active |
| Transition | Moves the chart from the step above to the step below. | Condition tag: your logic turns it on |
| Action | Ladder logic a step runs. Its qualifier (N, P, S, R, L, D) says when. | None |
| AND split and join | Runs several paths at the same time, then waits for all of them. | None |
| OR split and join | Takes one of several paths, then brings it back. | None |
| Dummy step | A step with no actions, to join or space out paths. | Status tag: on while active |
What happens each scan
- Each transition under an active step is checked. It passes when its condition tag is on and the step above has been active for its Minimum active (ms).
- The chart moves: the step above turns off and the step below turns on.
- Every step's status tag is written.
- The actions run, each as its qualifier says.
On the first scan the initial step turns on and its actions run. Transitions are first checked on the next scan.
The chart above, element by element
Startis the initial step. The chart is active there when the PLC runs.- Transition TR001 moves the chart to
Fillwhen its condition tag turns on. Fillhas one action with qualifier N, so it runs on every scan whileFillis active.- Transition TR002 leads into an AND split, so
MixandHeatturn on together.Heathas a D action, so it starts after its delay. - The AND join waits for both. Then TR003 moves the chart to
Drain.
Create a chart
- Stop the PLC. Editing is locked while it runs.
- In Project Explorer, right-click a program or its Routines folder and choose New Routine…
- Type a name. Under Language, choose Sequential Function Chart (SFC), then Create routine.
- Drag tiles from the chart palette onto the grid, or focus a tile and press Enter.
- Choose Create chart tags to give every step its status tag and every transition its condition tag.
Good to know
- Use a chart for logic that runs in order. Use ladder or FBD for logic that is checked every scan, such as an interlock.
- A chart is for learning and simulation, not a safety interlock.